
'/%3e%3crect%20width='1920'%20height='1080'%20fill='url(%23grid)'/%3e%3crect%20width='1920'%20height='1080'%20fill='url(%23glow)'/%3e%3cpath%20d='M-40%20720%20C%20280%20660,%20620%20600,%20980%20600%20S%201640%20540,%201980%20480'%20fill='none'%20stroke='%231e3a8a'%20stroke-opacity='0.22'%20stroke-width='2'/%3e%3c/svg%3e)
The audit-ready way to measure every emission.
ASAP replaces fragmented spreadsheets with one structured workflow for Scope 1, 2 and 3 — with built-in emission factors and full traceability from activity data to reported total.
Pricing, simplified
One flat price. No sales call. Built for Asset Managers and SMEs.
One flat price
Every module, every scope, unlimited records. No add-ons, no per-feature tiers.
No sales call
Sign up, test it, and start using it the same day. Self-serve from minute one.
Built for Asset Managers & SMEs
No pricing by headcount. No quote, no negotiation.
What you get
A single platform for your entire inventory.
Full Scope 1, 2 & 3 coverage
Built on the GHG Protocol. Every material direct and indirect emissions source in one place.
Built-in emission factors
CO₂ (kg), CH₄ (g) and N₂O (g) computed automatically as you enter activity data.
Audit-ready traceability
Mandatory supporting attachments and a complete audit log of every create, edit and delete.
Multi-year reporting & export
Manage annual inventories side-by-side and export to Excel or PDF in one click.
Modules
Every step of the inventory, covered.
From defining your reporting boundary to publishing the final dashboard — there's nothing to build, no template to maintain.
Reports
Create and manage annual GHG inventories — each report defines the year, status and scope.
Boundary Questions
A short questionnaire tailors which emissions sources apply, so you only see what matters.
Vehicles & Buildings
Register the assets that generate emissions once — they are reused across every category.
GHG Categories
Enter activity data across Scope 1, 2 and 3. Attachments mandatory for audit traceability.
Calculation Logic
Activity × Emission Factor. Three gases tracked, with handling for charter flights and offsets.
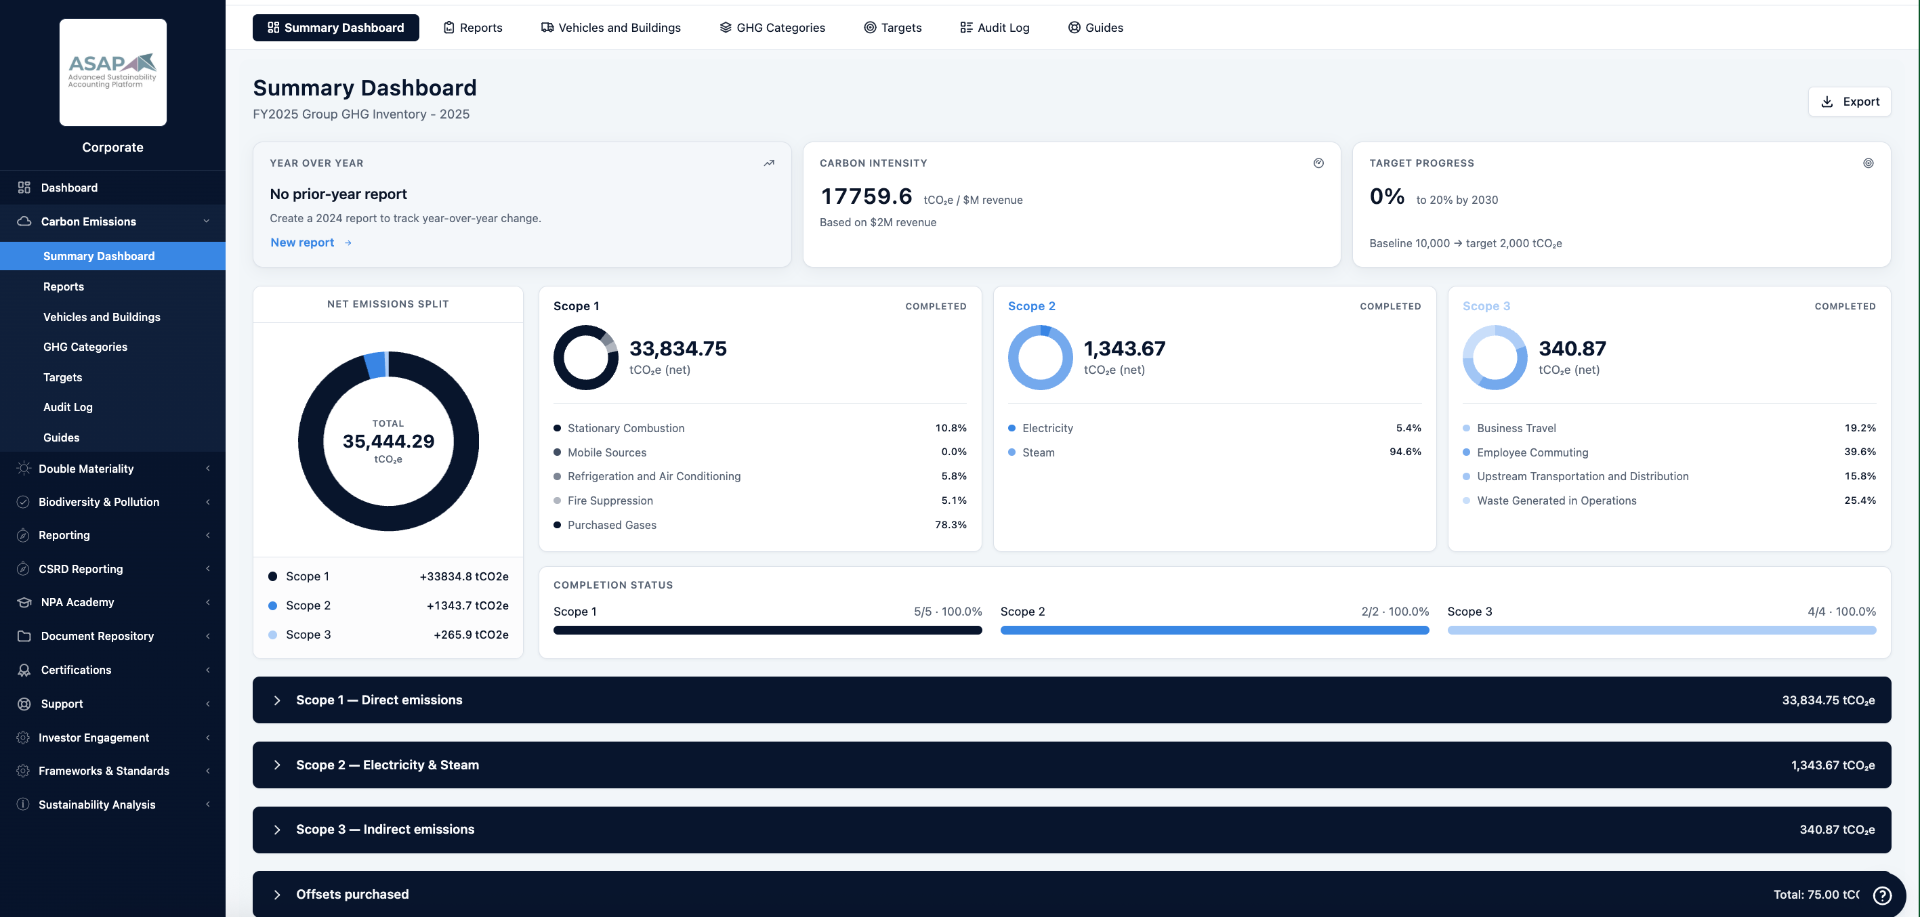
Summary Dashboard
Totals by scope and category, year-over-year comparison and one-click export.
Audit Log
Every change timestamped with the user, and every supporting document listed per report.
Categories covered
14 emissions categories, organized by scope.
Aligned to the GHG Protocol — only the categories relevant to your boundary appear in the app.
Designed for the team
Productive within minutes – not weeks.
Built for the people who actually compile the inventory, not just sustainability specialists.
Guided workflow
The boundary questionnaire hides categories that don't apply — users only see what's relevant.
Auto-calculated emissions
Emission factors apply as you type. No spreadsheets, no formulas to maintain.
One-click navigation
A 'Next Module' button walks through Scope 1 → 2 → 3, skipping anything you've ruled out.
Reusable assets
Buildings and vehicles entered once feed every category that needs them — no duplicate entry.
One-month free trial
Try the full calculator, free for a month.
One flat price — no sales call, no tiers. You won't be charged if you cancel within the month. Cancellation is one click, no questions asked.
- Full access to every module
- Unlimited records and attachments
- Full audit log and version history
- No charges if you cancel within the month
- One-click cancellation, no questions asked
- File exports (Excel & PDF)